
In 2023, a quota for unprocessed gold imports was introduced to mitigate the negative effects of the rise in gold imports on the current account balance. While this quota reduced the imports of unprocessed gold, it led to an increase in imports of jewelry. In this blog post, we analyze the impact of the quota-driven change in the composition of gold imports on consumption demand indicators.
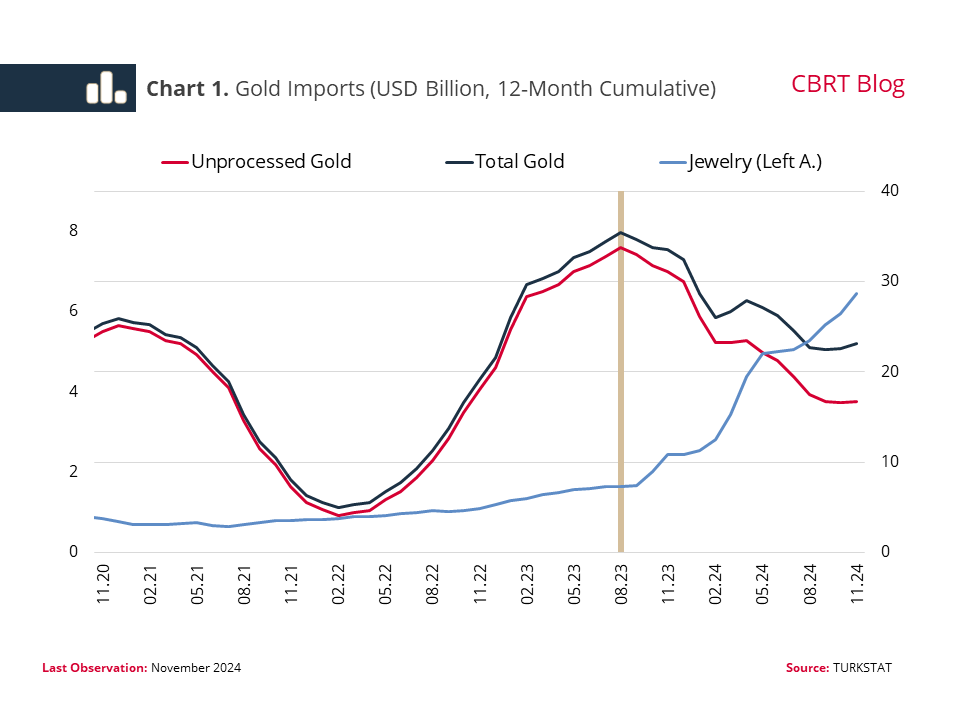
The global demand for gold and the gold price increased in recent years driven by factors such as the pandemic and geopolitical risks. In this context, Türkiye—where households traditionally exhibit a strong preference for holding gold—experienced a notable surge in unprocessed gold imports. However, following the implementation of the quota on August 7, 2023, imports of unprocessed gold dropped sharply (Chart 1). Twelve-month cumulative imports of unprocessed gold fell by half, from USD 34 billion in August 2023 to less than USD 17 billion as of November 2024.
Meanwhile, jewelry imports, classified as consumption goods, increased rapidly after the introduction of the quota. Twelve-month jewelry imports, which stood at approximately USD 1.6 billion in August 2023 when the quota was implemented, almost quadrupled to exceed USD 6.4 billion by November 2024. Over the same period, the combined value of unprocessed gold and jewelry imports declined from USD 35.5 billion to USD 23 billion. In other words, while total gold-related imports decreased after the quota’s introduction, there was a significant shift in their composition.
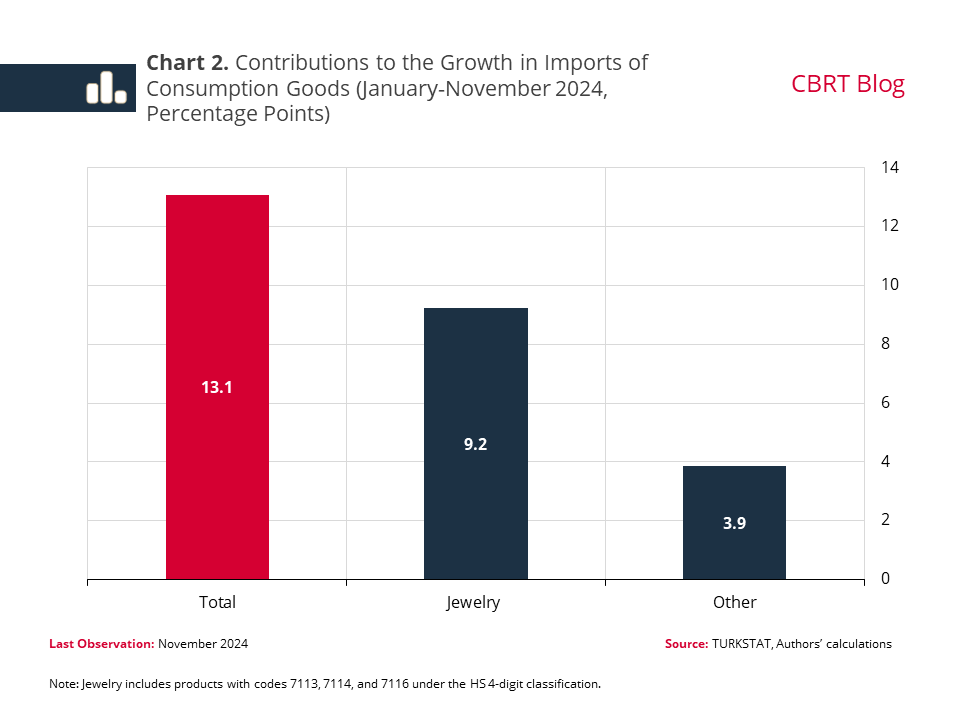
The change observed after the implementation of the quota calls for caution when assessing the trends in consumption goods imports. During the January-November period of 2024, imports of consumption goods increased by 13.1% compared to the same period the previous year, with jewelry alone accounting for 9.2 percentage points of this increase (Chart 2). This means that other consumption goods contributed only 3.9 percentage points to the overall growth. Hence, it is evident that the rise in consumption goods imports is not broad-based.
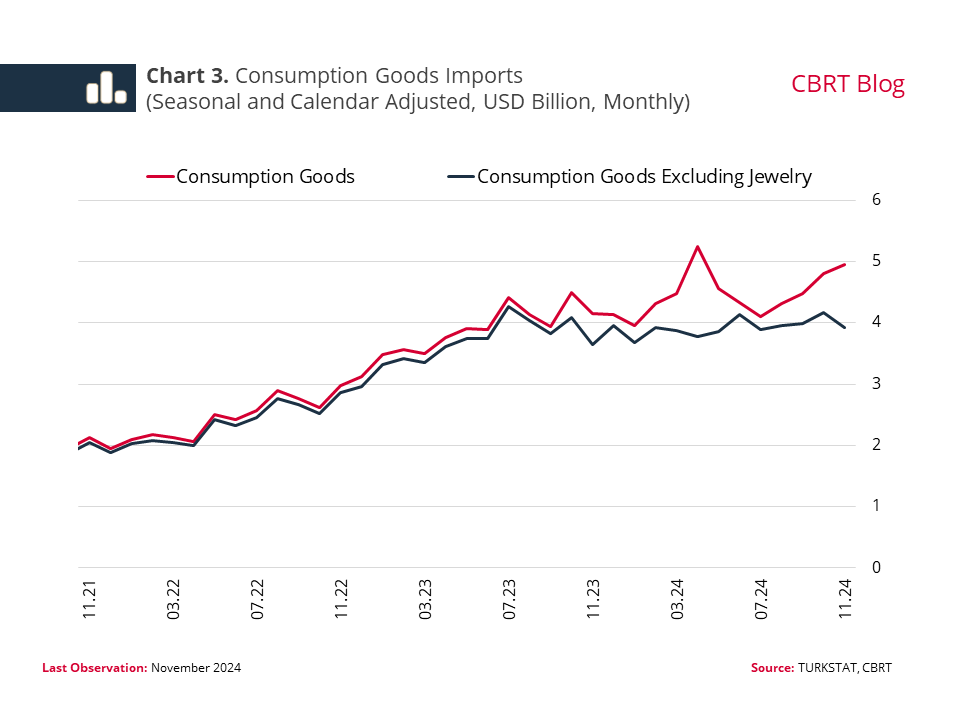
Recent movements in jewelry imports have caused sharp increases and volatility in consumption goods imports, particularly in certain months (Chart 3). This volatility complicates the use of consumption goods imports as a reliable indicator of demand. For instance, while imports of consumption goods registered a substantial increase of 17% in April 2024, this figure drops to an approximately 2% decline when jewelry imports are excluded. Likewise, although consumption goods imports appeared to surge significantly in the second half of 2024, they remained nearly flat when jewelry is excluded.
The divergence between these two indicators becomes even more pronounced in the 12-month cumulative data (Chart 4). While annual imports of consumption goods registered a rise in 2024, imports of consumption goods excluding jewelry remained roughly flat. These observations highlight the importance of accounting for the impact of jewelry imports, particularly when interpreting data on a monthly basis.

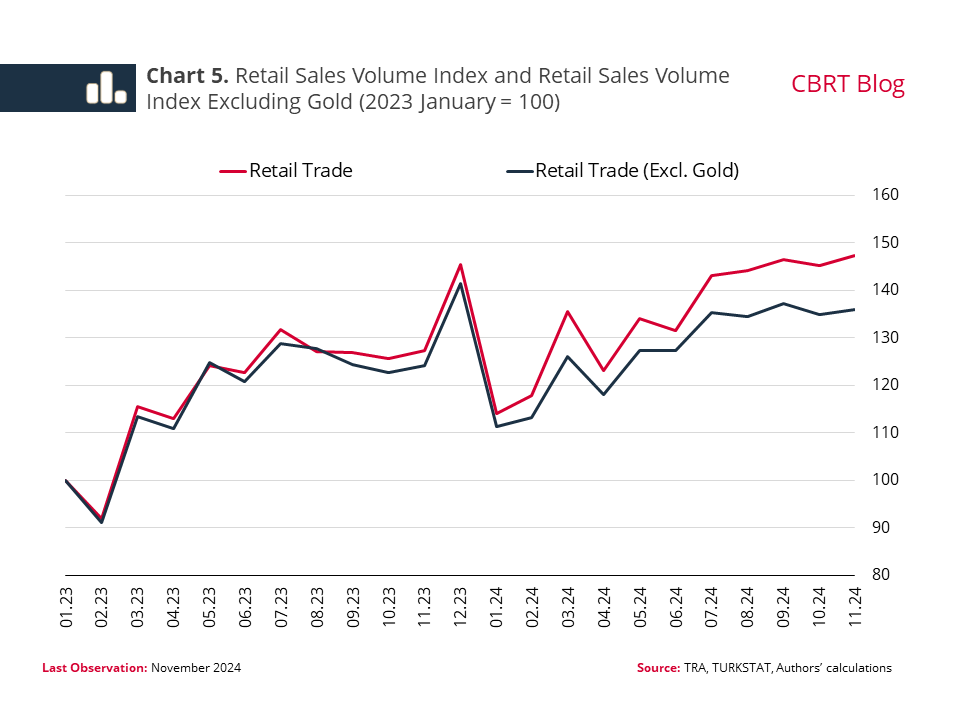
Retail sales volume indices reflect a similar pattern to the recent trends observed in foreign trade data. The overall trajectory of the retail sales volume index is notably influenced by developments in the "retail sale of watches and jewelry" sub-sector, where the majority of turnover is driven by gold and gold products. To provide a clearer analysis of underlying consumption trends, a "retail sales volume index excluding gold" has been calculated by excluding the "retail sale of watches and jewelry" from the total retail sales volume.[1] This index has been significantly below the retail sales volume index since June 2023, and has been essentially flat since July 2024 (Chart 5).
In summary, the implementation of the quota resulted in a significant shift in the composition of gold imports. While imports of unprocessed gold, classified as intermediate goods, declined sharply due to the quota, jewelry imports, categorized as consumption goods, surpassed historical averages. This shift in jewelry demand is also evident in the retail sales volume index. Therefore, it is crucial to take these developments into account to obtain a more accurate interpretation of indicators related to consumption demand.
[1] For details of the index, see Zoom-In 2.2, Inflation Report 2024-IV.