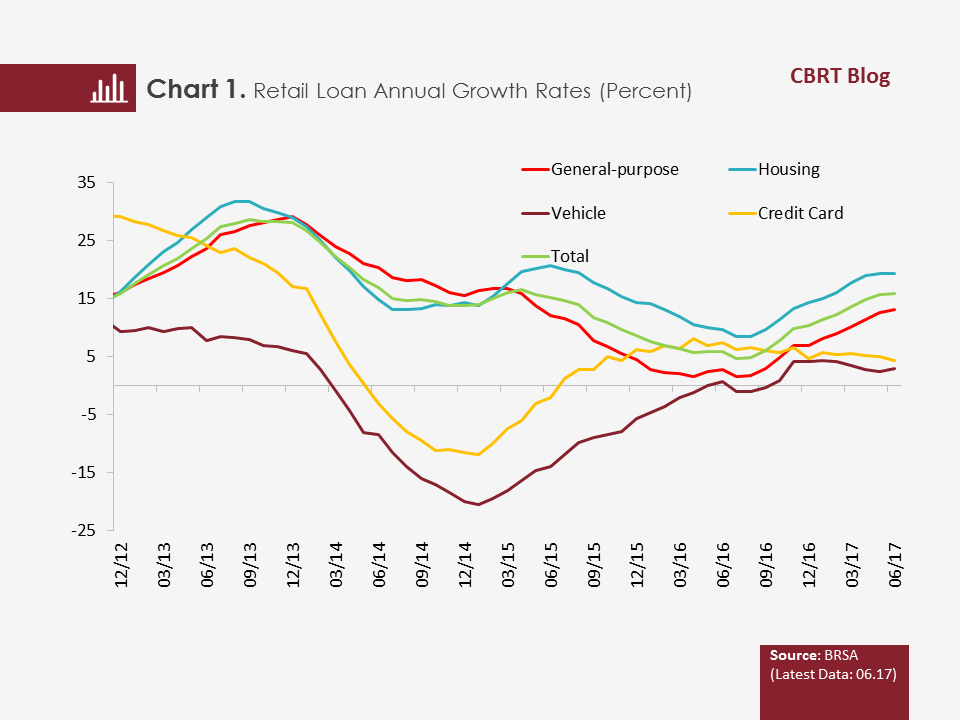
Through amendments made to macroprudential policy regulations by the Banking Regulation and Supervision Agency (BRSA) in September 2016, the maturity cap on general-purpose loans was raised to 48 months from 36 months, and a facility was introduced for the restructuring of general purpose loans with up to 72-month maturity. Moreover, the cap on the loan to value ratio (LTV) for housing loans was increased to 80 percent from 75 percent. These changes had a favorable impact on the growth rates of the two major items of retail loans, namely housing loans and general-purpose loans, which played an important role in the recovery in the annual growth rate of total retail loans in the last quarter of 2016 (Chart 1) [1]. In addition to the amendment in regulation, interest rate developments during the same period also contributed to housing loans remaining the fastest-growing retail loan item. However, as longer maturities in general-purpose loans and lower downpayment ratios in housing loans attracted new customers to the loan market, the identification of these new customers’ debt service capacity is crucial for credit risk analyses. Therefore, it would be fitting to analyze developments in maturity and loan facility using a breakdown of debtor Retail Loan Scores (RLS)[2].
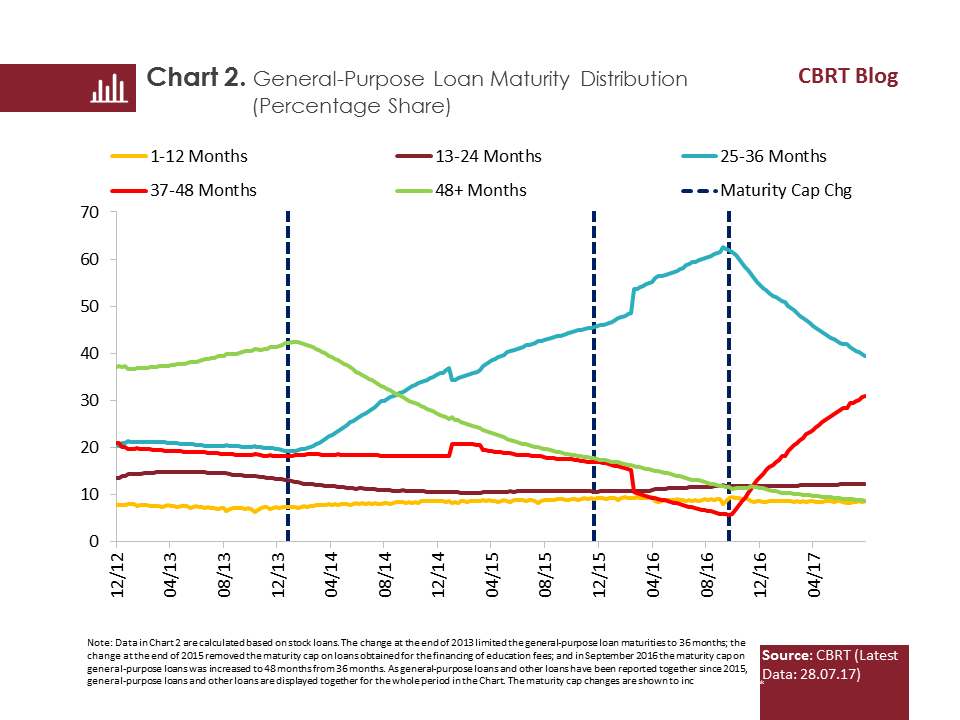
As can be seen from the aggregate data, the share of the maturity bracket of 25-36 months in total general-purpose loan maturities had steadily increased since 2014 but following the latest amendment, there has been a shift in shares to maturities between 37-48 months due to the change in consumer preferences and banks’ lending policies (Chart 2). Thus, we see that the increased maturity cap on general-purpose loans has been influential in the determination of maturities for new general-purpose loans. The regulation extends the maturity of a loan of the same amount to a longer time span and thus allows more favorable levels of monthly outstanding loan liabilities, which suggests that general-purpose loans extended during this period may show a sounder repayment performance.
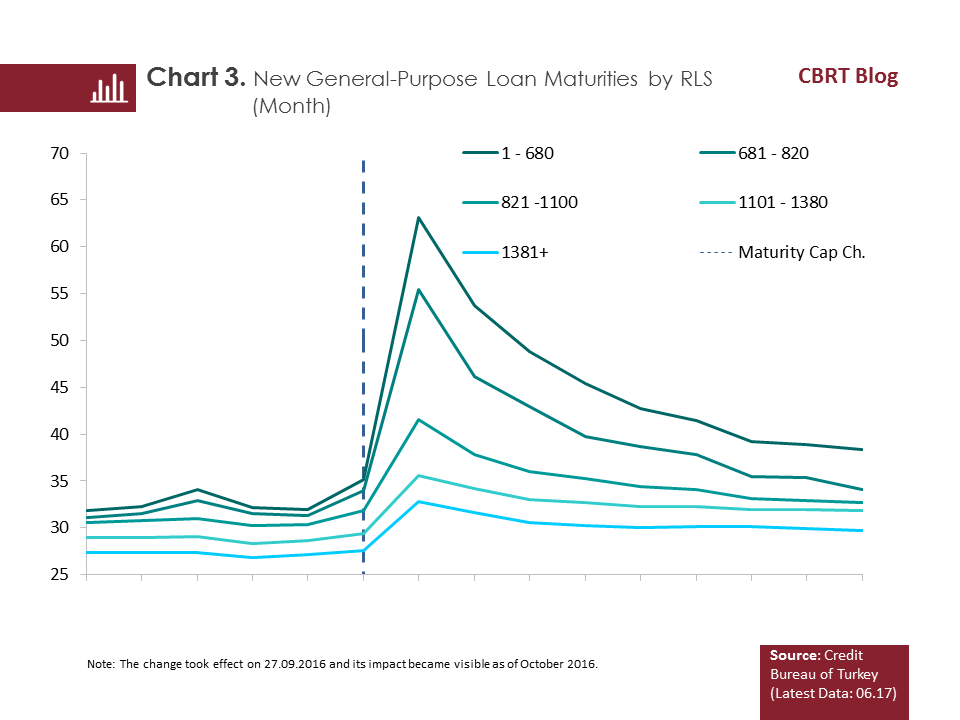
A breakdown of maturities by RLS reveals that the increases in maturity were higher in low-RLS groups and lower in high-RLS groups in the first months following the change in the maturity cap (Chart 3). As such, low-RLS groups who are likely to be subject to financing constraints were relatively more relieved in terms of debt service capacity. The maturity structure of general-purpose loans shows that maturities are longer in low-RLS groups, and that groups with a low loan score benefited the most from the increase in the maturity cap. This is in line with the relevant literature which asserts that risky projects opt for financing structures with longer maturities[3]. Two groups with the lowest RLS (1-680 and 681-820), where the average maturity exceeded the 48-month cap, benefited from the eased restructuring facilities in this period but this development is deemed to reflect a short transition period since average maturities in these two groups sharply declined in the subsequent months. In recent periods, in line with banks’ lending policies and consumers’ demand for loans, the average maturity of general-purpose loans has stabilized at a higher level compared to the period before the change.
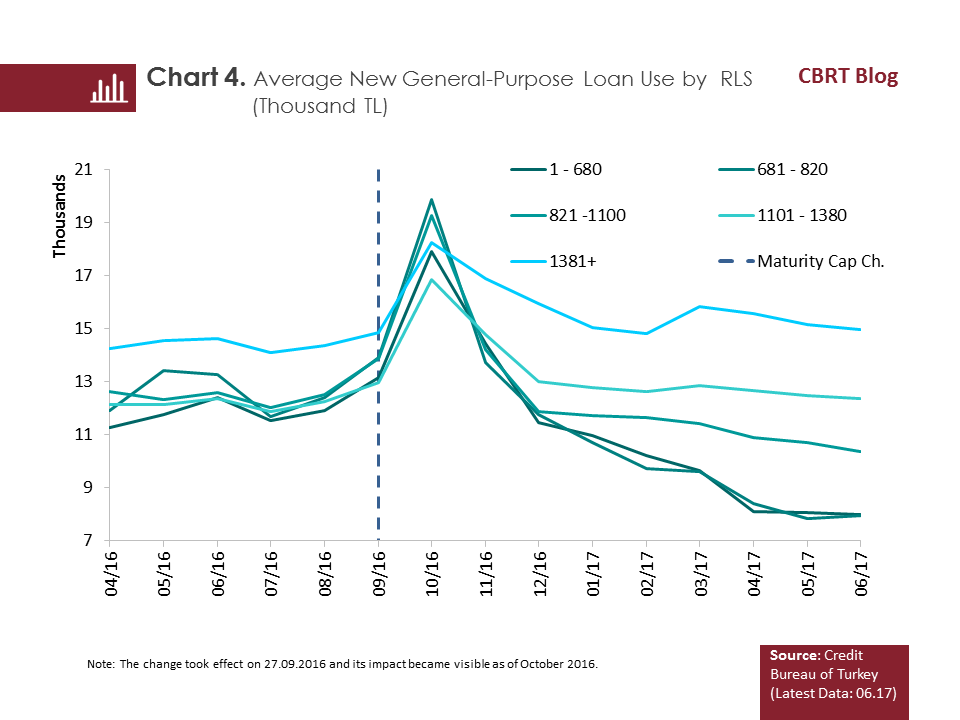
The average general-purpose loan amounts increased across all groups for a short period of time following the change (Chart 4). However, it is striking that in the last quarter of 2016, the low-RLS groups did not diverge from other groups in terms of average balance due as they did in terms of maturities. In 2017, while the average loan usage for high-RLS groups returned to its level before the policy amendment, the usage for low-RLS groups is bound for levels below those prior to the change. The recent period in which maturities have lengthened and average loan amounts have decreased compared to the past points to easing debt service conditions for low-RLS groups, which stands out as a development supporting the credit asset quality of this group. Banks’ increased maturity risk in consumer loans due to longer maturities has been partially eliminated by decreasing loan amounts.
The LTV ratio in housing loans is calculated based on the market value of the house appraised by real estate appraisal companies[4]. The chart below shows the distribution of LTV ratio calculated from these appraisal values and loan amounts during the nine-month period before and after the amendment, and reveals at which ratios the loans are concentrated (Chart 5). Almost a third of the loans extended in the nine-month period from January 2016 through the effective date of the amendment (27 September 2016) were provided at the cap of 75 percent, and the distribution shows some concentration around 50 and 60 percent values.
On the other hand, following the amendment, about one fifth of the housing loans extended in the nine-month period were provided at the new cap (80 percent). In this elevated cap period, concentrations at levels of 50 percent and 60 percent persisted. The reduced concentration on the LTV ratio cap after the amendment supports the fact that housing loan borrowers use loans in proportion to their current credit needs rather than the full extent of available loan facilities.
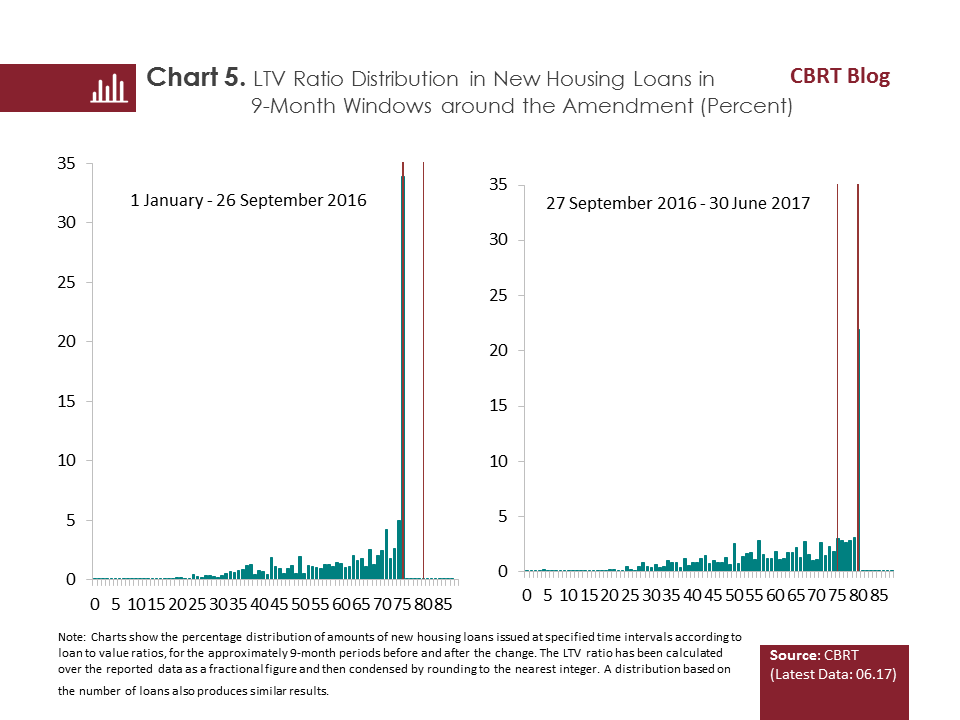
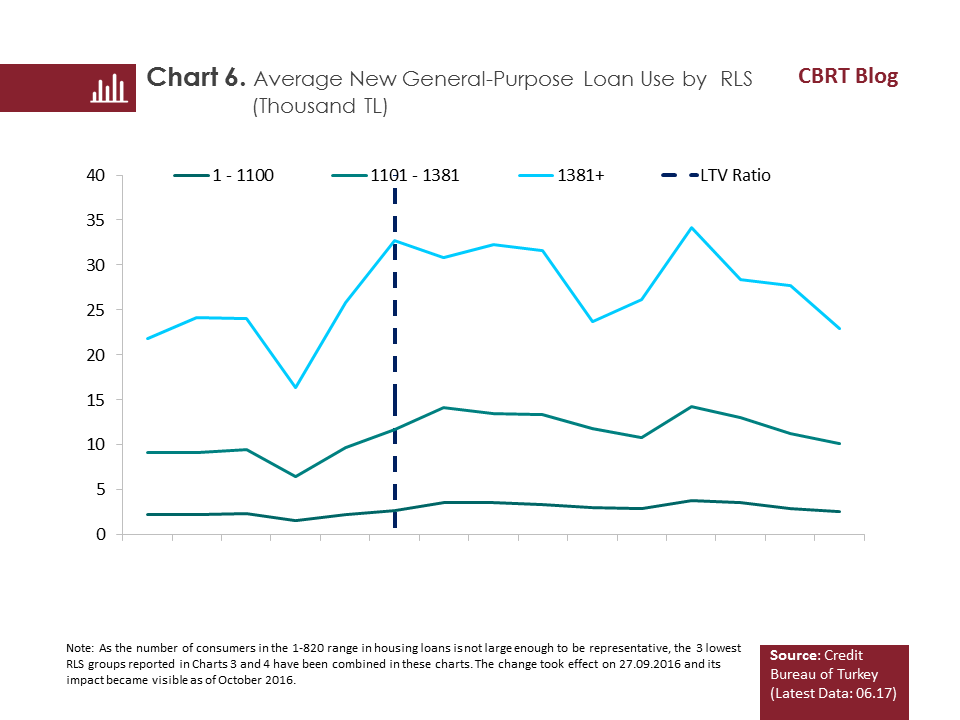
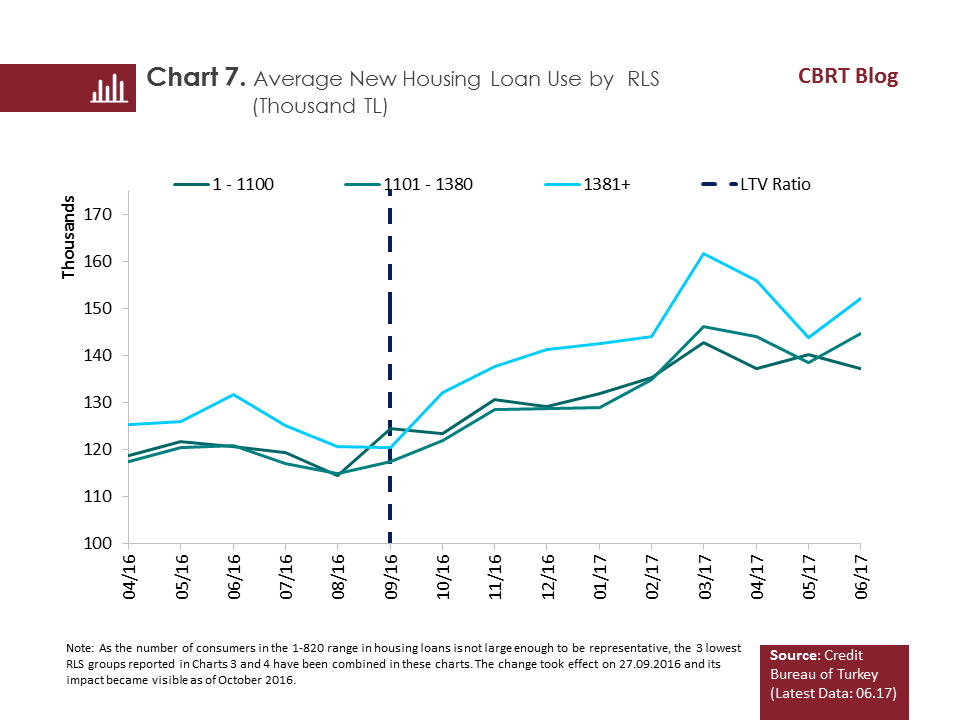
A segment of consumers borrowing at the housing LTV ratio cap are deemed to be consumers with scarce financial resources. The increase in the LTV ratio cap has allowed this type of consumers to borrow larger amounts. The distribution of debtors and their credibility in the period following the amendment gains importance in evaluating the impact of this development on credit risk. As shown in Charts 6 and 7, throughout the whole period, the largest share in terms of both the number of debtors and the average loan utilization belongs to individuals in the high-RLS group who have a positive credit repayment history, are highly credible and likely to be from the high-income segment. After the amendment, the highest increase in the number and average amount of loans was also observed in the two highest-RLS groups. This indicates that the housing loans, which are currently a safe balance sheet item due to their collateral structure, will maintain their high asset quality in the upcoming periods as well.
[1] The document on the amendments to regulations is available in the Official Gazette No. 29840. A full list of macroprudential policies can be found in the CBRT’s Financial Stability Report issued in May 2017.
[2] Data on RLS groups have been compiled and reported by the Credit Bureau of Turkey based on various assumptions from data reported by member institutions of the Risk Center of the Banks Association of Turkey. The RLS takes a value between 1 and 1900, and a higher score indicates a better credit history. The zero (0) score group consisting predominantly of consumers with no credit history has been excluded from the analysis. Although there is no direct relationship between the RLS and income groups, the high-income group is likely to have a good credit repayment history and thus appear in the high-RLS group.
[3] According to Flannery (1986), firms that may have difficulty in finding new sources for their long-term risky investments offset this liquidity shortage by obtaining long-term loans despite a high interest rate. In retail loans, this situation is consistent with the fact that individuals with a low credit score use loans at longer maturities. Similar findings obtained through the breakdown of maturities by the RLS for previous periods were analyzed in Box III.1.1 in the Financial Stability Report issued in May 2016.
[4] The analysis only includes housing loans for houses appraised by real estate appraisal companies authorized by the Banking Regulation and Supervision Agency and the Capital Markets Board of Turkey. Houses in the project design phase that have not been appraised are excluded from the analysis.
Financial Stability Report May 2016 Volume: 22, Box III.1.I: Macroprudential Policies for Retail Loans. Pages 38-42.
Financial Stability Report May 2017 Volume: 24, Appendix I: Macroprudential Regulations on Retail and Corporate Loans. Page 96.
Flannery, M.J. (1986). ‘Asymmetric Information and Risky Debt Maturity Choice,’ Journal of Finance, v.41, pages 19-37.
Credit Bureau of the Risk Center of the Banks Association of Turkey.